
Here’s the part nobody warns you about.
You do the work before you invest. You read the memo, you ask the questions, you decide the sponsor is worth trusting. Then you wire the money, and the deal goes quiet. A PDF shows up one quarter. A spreadsheet the next. A letter at year end that mostly says things are going well.
None of it answers the question you actually have, which is simple. Is this working?
That question is the reason we built what we built. Not a nicer place to store documents. A way for someone who put money into one of our buildings to look at a screen and know how it’s doing against the plan it was bought on.
Everything in one place, so there’s nothing to go hunting for
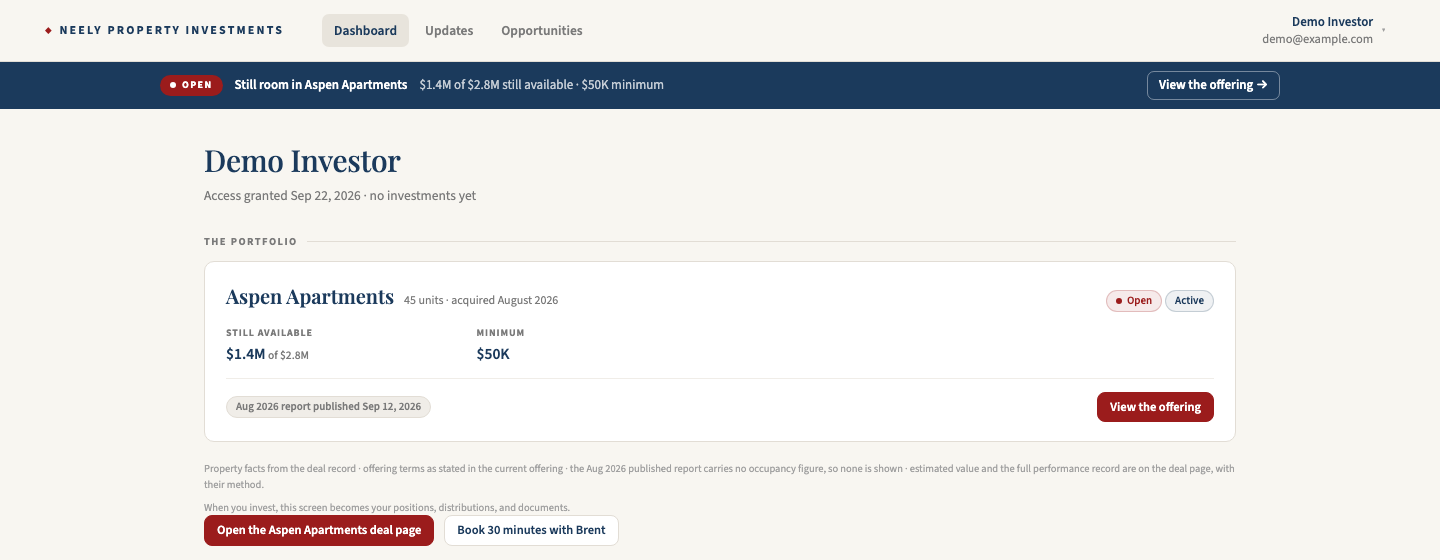
Every deal you’re in, every document, every update, every distribution, on one screen. Not an email thread, not a shared folder link somebody sent in March, not a spreadsheet version you can’t be sure is current.
The benefit isn’t tidiness. It’s that you stop needing us to answer questions you should be able to answer yourself. The current rent roll date, the last report, what you’ve been paid, what the loan looks like. You should have that at eleven at night without emailing anybody.
What the building actually earns, against what we said it would
Net operating income is what’s left after the building pays its own bills. It drives what gets distributed to you and what the property is worth when it sells. It is the number.
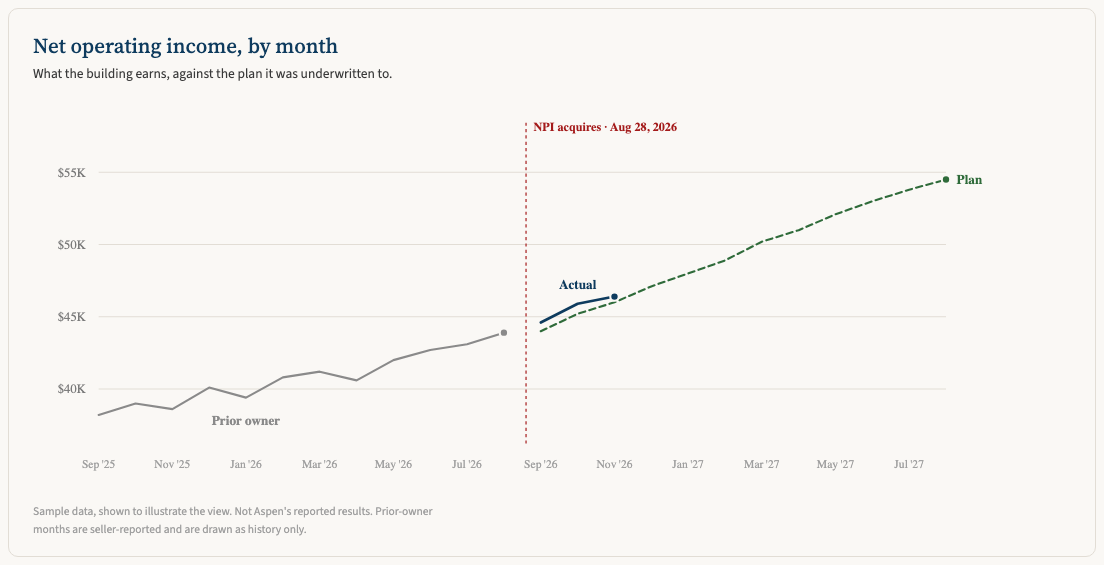
Three lines, and the shape is the story.
Gray is the prior owner’s reported history, so you can see what the building did before we touched it. Green dashed is the plan, the same underwriting the deal was bought on and the same file every projected number comes from. Navy is what happened once we owned it.
What that gets you: you can watch the gap close or not close, every month, without knowing how to read a financial statement. If navy runs above green, the thesis is landing early. If it runs below, something costs more or earns less than we said, and you see it when we do.
Every lease we sign, at the rent we signed it
Most value-add deals come down to one claim. Rents are below what the market will pay, and we’re going to close that gap. Everything else follows from whether that turns out to be true.
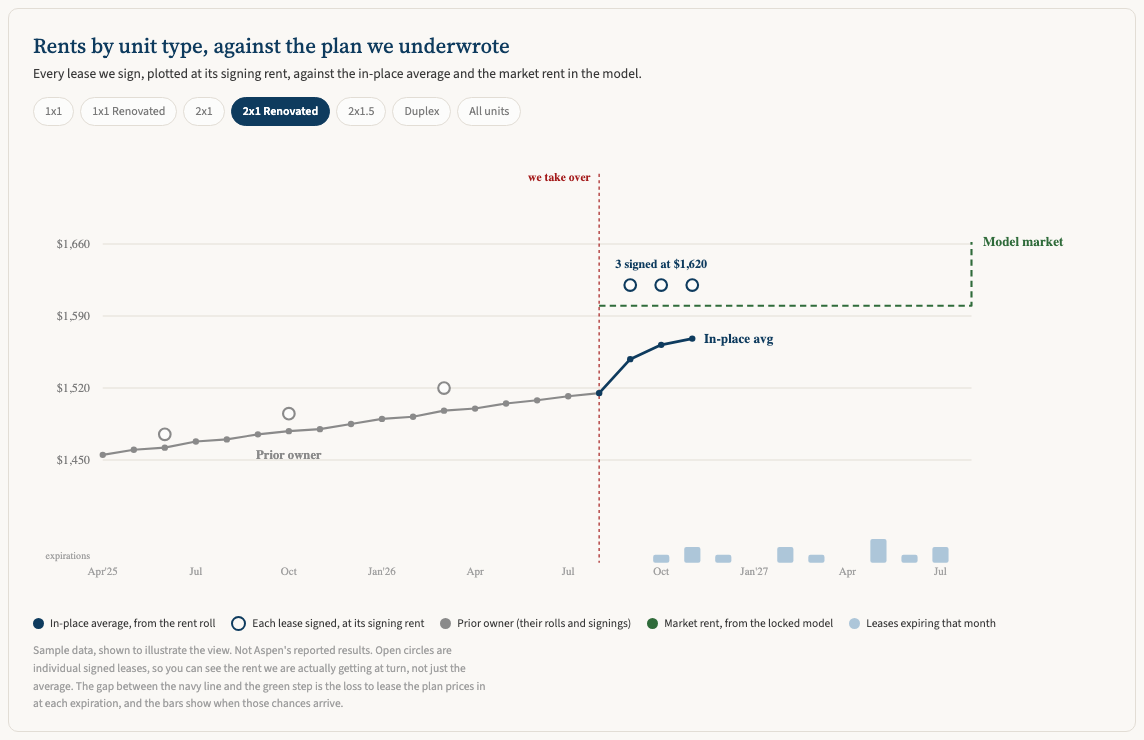
So we put the whole thing on one screen, by unit type.
The navy line is the in-place average off the rent roll. The open circles are individual leases, each one plotted at the rent it actually signed at, because an average hides the thing you want to see. The green step is the market rent in the locked model, which is the number the whole deal was underwritten on. The bars along the bottom are leases expiring, which is to say the months where we get a chance to move the rent.
Read it this way. Circles sitting above the green line mean the leases we’re signing are beating the rent the model assumed, which is the best early signal a value-add deal gives you. The navy line lags below them on purpose, because an average only moves as leases turn, and most of the building is still on its old rent. The distance between navy and green is the loss to lease, and the bars tell you when we get to go after it.
If the circles ever start landing under the green line, that’s the early warning, and you’d be looking at it the same week we are.
Switch unit types and the picture changes, because a renovated two bedroom and a classic one bedroom are different businesses inside the same property. That’s a thing you can only see if somebody shows you the leases instead of the summary.
The reasoning, not just the result
A running feed, newest first. The lease-up, the renovation that ran long, the insurance renewal that came in over budget, the month we missed the plan and what we’re doing about it.
Numbers tell you what happened. The feed tells you why, which is the part that’s actually hard to get.
You get to learn how a building like this is run
This is the benefit we’d put first if we thought you’d believe it up front.
Most passive investing teaches you nothing. Money goes out, a distribution comes back, and five years later there’s a sale. You end up with a return and no better idea of how any of it worked than when you started.
Watching a deal operate month by month is different. Read a year of it and you’ll know things that take most people a building of their own to learn. How long a renovation actually takes to show up in rent. What a property manager change costs before it pays. Why insurance is the line that breaks budgets now. What an expiration schedule does to your ability to move rents, and why a building full of leases ending in January is worth less than one that staggers them.
None of that is theory. It’s one real building, with our money in it next to yours, reported whether it’s going well or not.
And it’s portable. It makes you better at judging the next deal you look at, including the ones that aren’t ours. We’re fine with that. An investor who understands what they own is easier to work with than one who needs reassurance, and they tend to come back.
Why we’d rather show you this than tell you about it
Transparency is the easiest thing in this business to claim and the most annoying to verify. Every sponsor says they’re transparent. Very few will hand you a screen with their own plan on it and let you watch whether they hit it.
The sample data in those charts is there to show you the view, not our results. The real numbers go in as the months close.
It opens to investors in the next week or two, starting with the 45-unit Boise property we closed in August.
If you’re interested in learning how to invest in one of our deals, book a call and we’ll walk you through it. Or start with the deals themselves, where the terms, the fees, and the underwriting are already posted.
A short personal note from me most Fridays about what actually happened that week. Subscribe to the Friday letter.